infographics
The infographics below tell stories with numbers. Concepts and copy are original. The designs came to life through the work of several talented graphic designers.
UNC-CHAPEL HILL SAMPLES
The “NC Invested Profiles” demonstrate the local economic and social impact of UNC innovation and entrepreneurship in three North Carolina counties: Orange County, Carteret County and Watauga County. These examples show three multi-graphic sets (one set per county). Each infographic set follows a similar content structure organized through the lenses of talent, innovation and place.


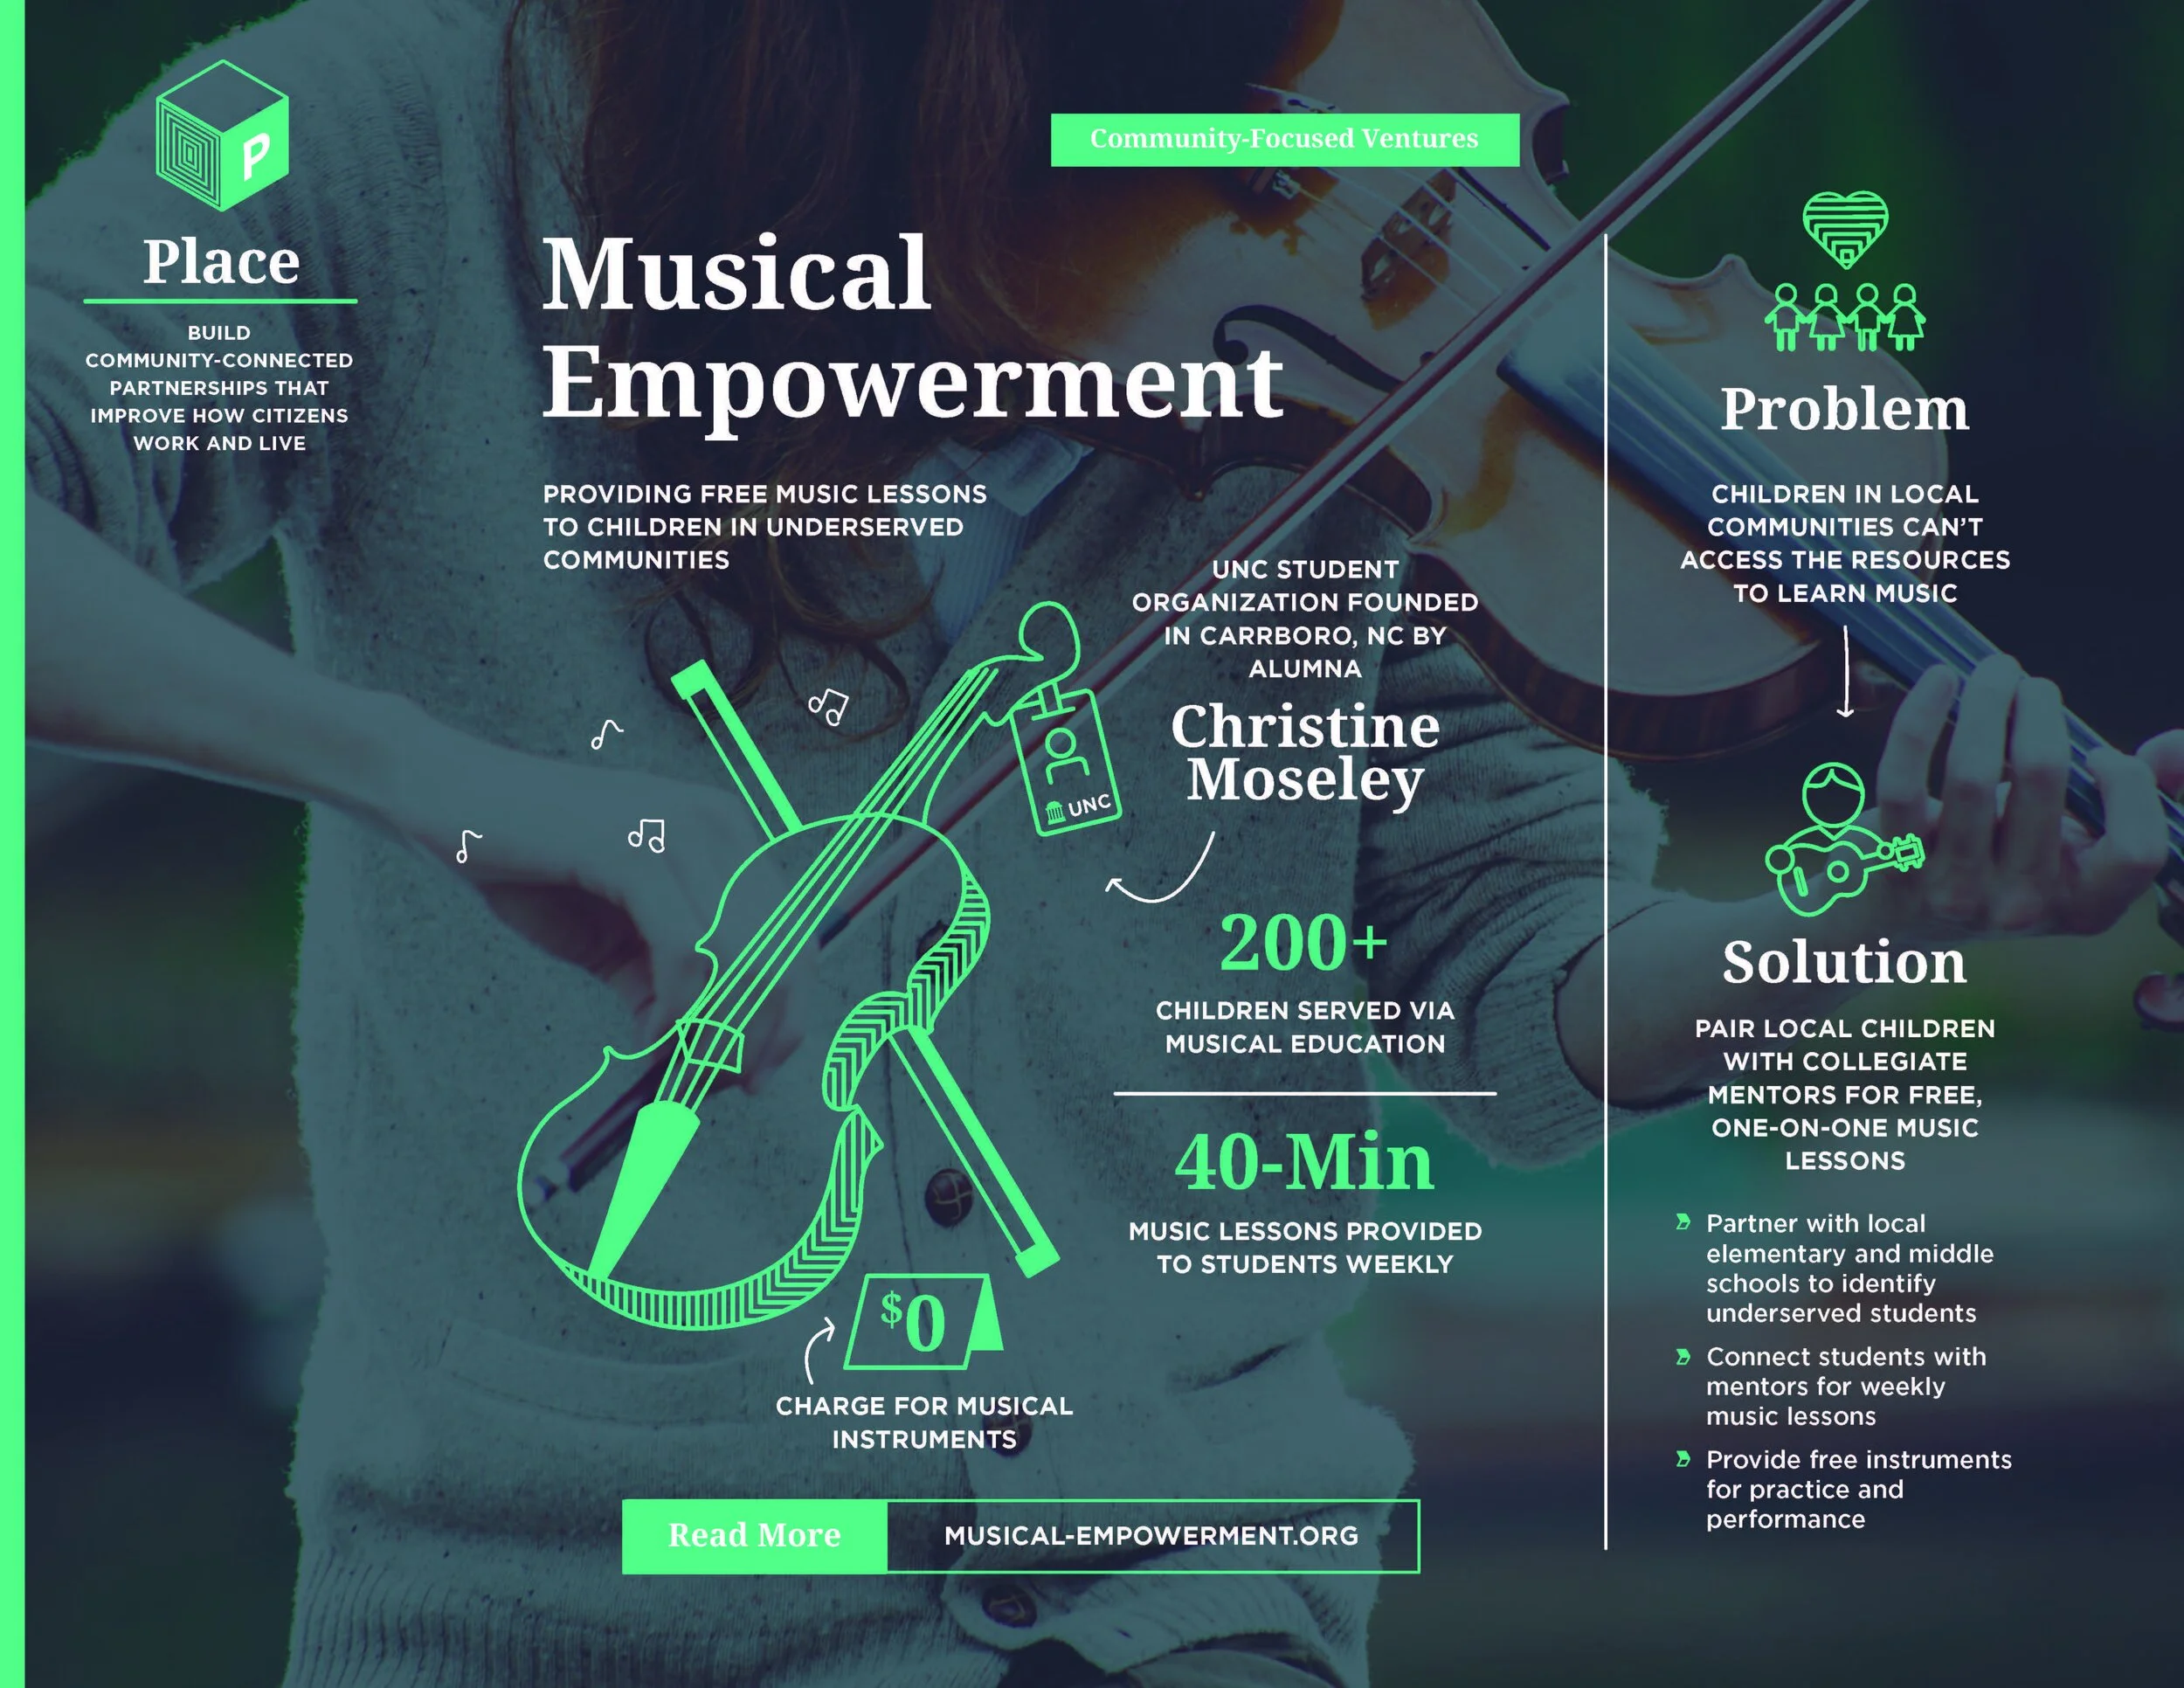


Copywriting: Brock Pierce
Art Direction: Carrie Keymel
SAS SAMPLES
"The Nuts and Bolts of Analytics" was the first infographic created at SAS and served as the model for ones that followed. It distilled the key findings from a report about the use of analytics in the manufacturing industry. The second infographic showcases SAS' revenue growth and key areas of business success for the year 2014. This graphic was created in conjunction with SAS’ annual report and released as part of the written press release as a way to highlight key findings for media.
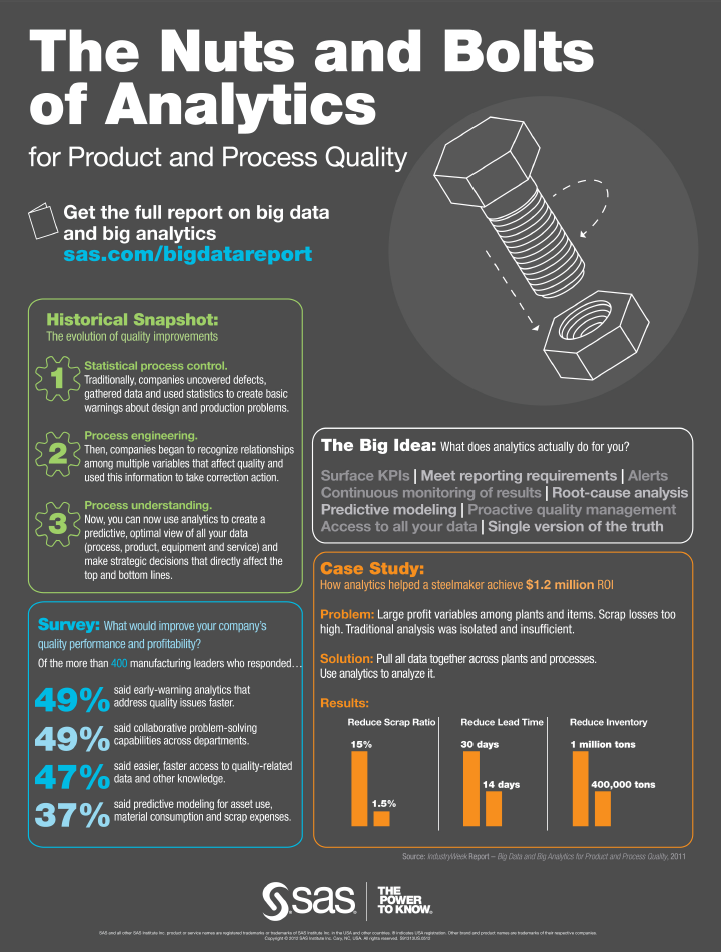
Copywriting: Brock Pierce
Art Direction: Luis Franco
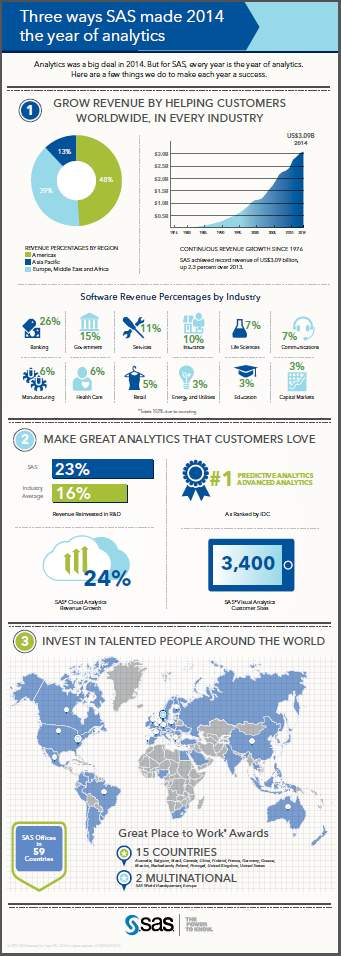
Copywriting: Brock Pierce
Art Direction: Jennifer Rehm